If you use Google Analytics as a tool to understand how your audience engages with your digital collection, you may come across a spike of hits on a particular day or over a particular month, with no immediate reason why. Therefore, it's logical that you may want to investigate, in order to understand more about why it has occurred.
Note that the following information applies to Universal Analytics, not Google Analytics 4.
To learn more about the source of a hit spike, try these steps to investigate:
Step 1: Visit the Audience -> Overview report, and set the time period to encompass the hit spike. If the spike happens over less than a week, we can use a week time period, or if the spike happens over a month, we can choose a month. Be sure to also enable "Compare to: previous period" to help make differences in traffic stand out in the reports.
Step 2: Take a look at the acquisition channels (from the Acquisition -> Overview report) to explore possible sources for this traffic.
Here you can see listed (and click to further explore) the change in traffic for each channel, whether that be:
- Referral (traffic from another website),
- Direct (when users directly type in the URL, or access the URL from a bookmark, or when the source of the referral is masked through web browser settings),
- Organic Search (when a user arrived at this page via a search engine),
- Social (if the user arrived at this page via a social media network like Twitter or Facebook).
Because we enabled "Compare to: previous period" in Step 1, under each channel the % change is listed from the previous time period, and if this change is relatively high, that could indicate a source or sources of the hits for a hit spike.
Step 3: Explore the Audience -> Geo -> Location report to look for concentrations of traffic from particular geographical locations.
Let's explore two hit spikes using the above suggested method. We will use hit spikes we noticed on elephind.com as examples here (Elephind is a historical newspaper search engine we created to make it possible to search a variety of online historic newspapers from one place). Although Elephind is a search engine rather than a digital collection, the same principles apply when investigating hit spikes.
Disclaimer: Please note that these statistics are (in general) not perfect representations of the truth, and their accuracy is affected by many factors in web technology, including privacy, security, and permissions settings on user browsers. In particular, the gradually increasing trend to provide more options for users for privacy and security is gradually reducing the clarity and accuracy of information available in systems such as Google Analytics.
However, a significant amount of information about the devices and technology of users is still available, which is useful for guiding informed decisions about how to best support the particular audience of each specific digital collection.
Example hit spike 1: elephind.com - September 2014
The first hit spike we'll look at happened way back in 2014. Looking at the Audience -> Overview report, we can see a spike that peaked on Monday September 22, 2014.
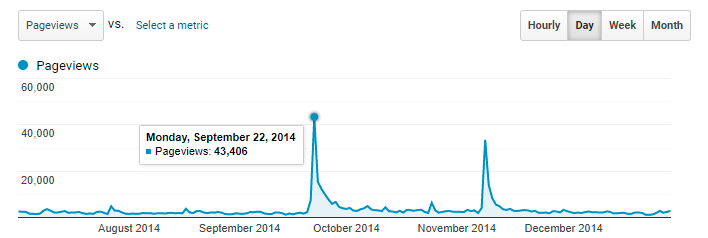
Step 1: Visit the Audience -> Overview report, and set the time period to encompass the hit spike.
Most of this spike happens within a week, so we can set the date range to 7 days beginning September 20th, and enable "Compare to: previous period" to compare with the previous week through the reports.

This gives the following view of the hit spike:
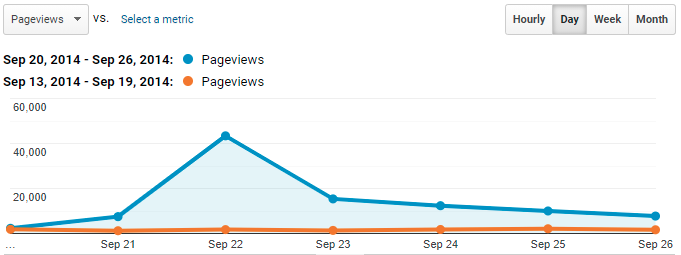
Step 2: Take a look at acquisition channels (from the Acquisition -> Overview report) to explore possible sources for this traffic.
With this date range, the Acquisition table on the Acquisition -> Overview report looks like this:
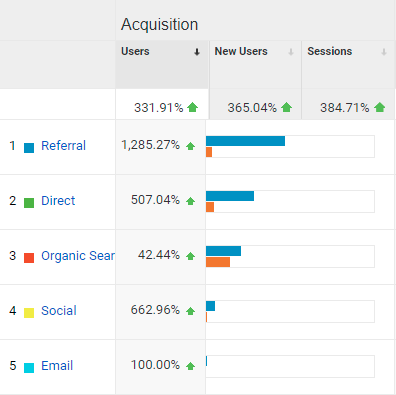
We can see a relatively large increase in traffic from referral, direct and social sources, and a modest increase in organic search traffic. A description of these different kinds of traffic is at the beginning of this article under Step 2.
If we click on Referral in the above table, we are taken to the Acquisition -> All Traffic -> Channels report with the Referral channel grouping selected, which provides a breakdown of the sources of the referral traffic. The first few entries in the table look like this:
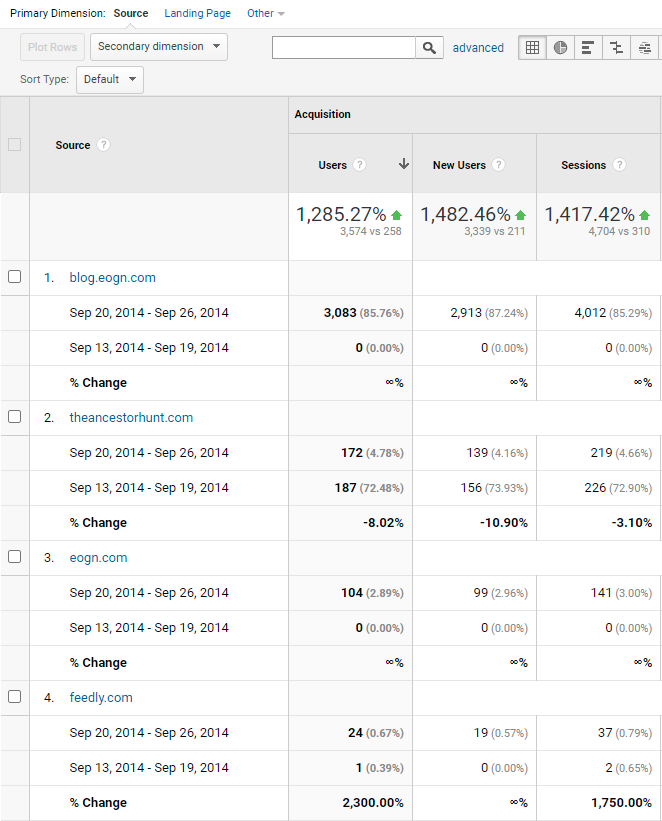
Here we can see that a very significant amount of the referral traffic is coming from blog.eogn.com, and that the previous week no traffic originated from that source. We can further drill down and determine the originating URL by clicking on blog.eogn.com in this table, resulting in the display below:
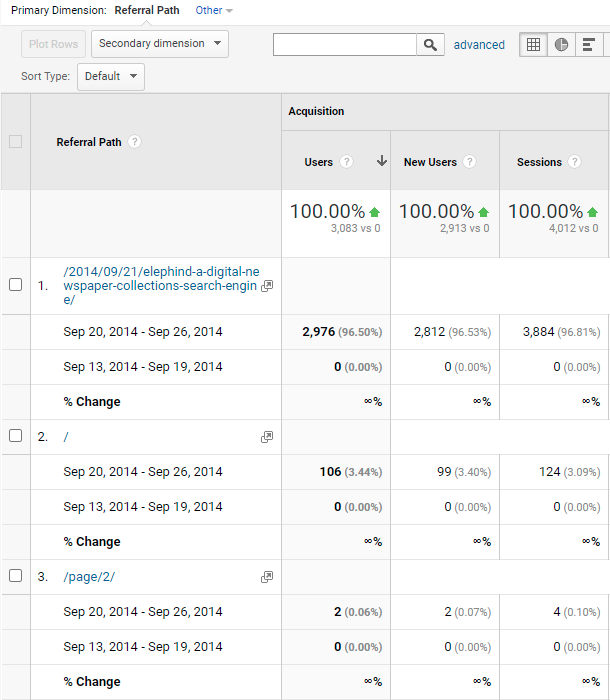
This table shows that most of the hits from blog.eogn.com originated from this URL:
http://blog.eogn.com/2014/09/21/elephind-a-digital-newspaper-collections-search-engine/
This was a blog post on the popular Eastman's Online Genealogy Newsletter. Interestingly, this particular URL actually no longer exists on that site.
It seems likely that a significant amount of the direct and organic search traffic came from users reading that blog post, then typing elephind or elephind.com into their browser and either directly arriving at elephind.com or being directed to elephind through a search engine.
If we go back to the Acquisition -> Overview report and click on social, we can take a look at the breakdown for social sources, where we see the following (abridged to remove previous week’s numbers for brevity):
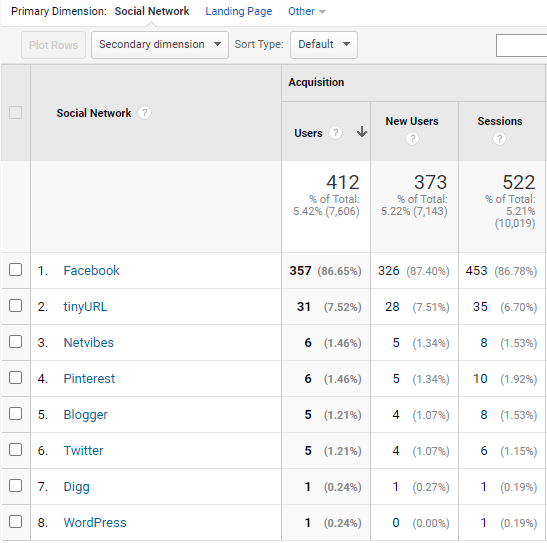
All of these numbers were significantly higher than for the previous week.
Step 3: Explore the Audience -> Geo -> Location report to look for concentrations of traffic from particular geographical locations.
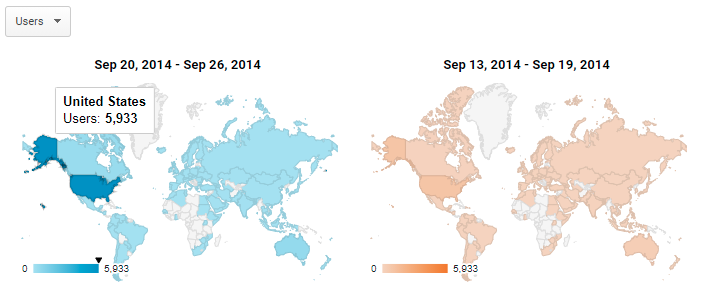
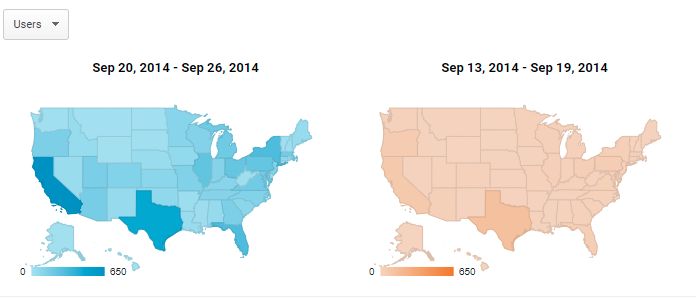
Now it's time to look at the geographical breakdown. In this case the Location report shows a visible increase in users from the United States.
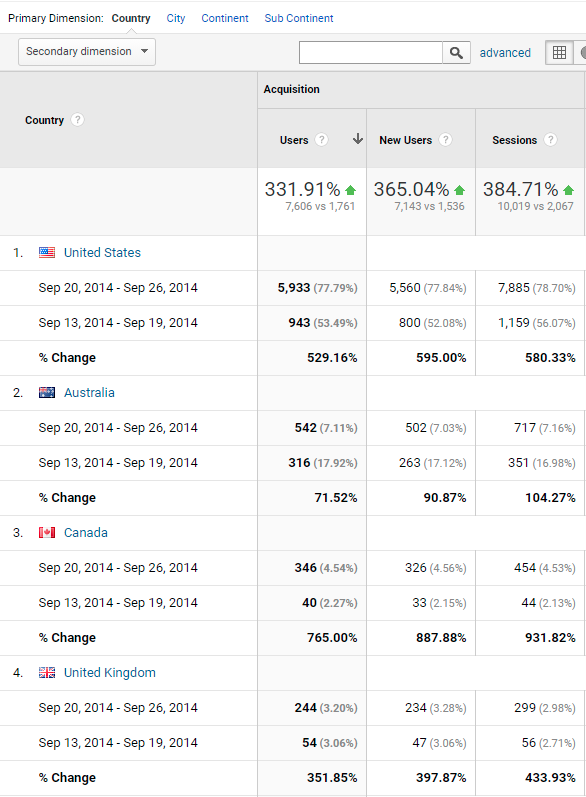
However, the first few items in the table below this show significant increases in users from multiple countries, including Australia, Canada, the United Kingdom, New Zealand, Spain, the Netherlands, Germany, Ireland, France, Brazil, Norway, Israel, Indonesia and Russia.
We can explore locations in more depth by either clicking a location on the map, or in the table. If we click the United States, we get this view, showing significantly higher numbers from California, Texas, New York, and Florida. Interestingly, looking down the list all 50 US states (+ DC) had hit increases of more than 100% (some over 1000%) except for one, Montana, which increased by 20%.
We could then click on California which shows a stark contrast compared with the previous week:
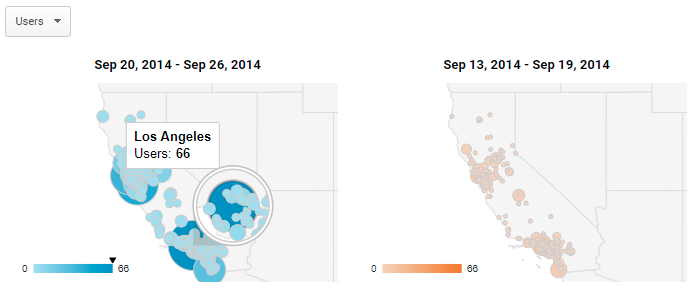
The larger circles indicating user numbers for the week of the hit spike are very clear compared with the previous week. Note that the finest granularity available in these location reports is to the level of city.
We can fairly safely conclude from the investigation of this hit spike that it was caused by a post on Eastman's Online Genealogy Newsletter, and as a result of that post a significant number of users arrived on elephind.com via referral, directly, via organic search, and via various social networks. The users that arrived during this event were situated in many countries across the world and seemingly from every single state across the United States and DC.
Example hit spike 2: elephind.com - From April 2021
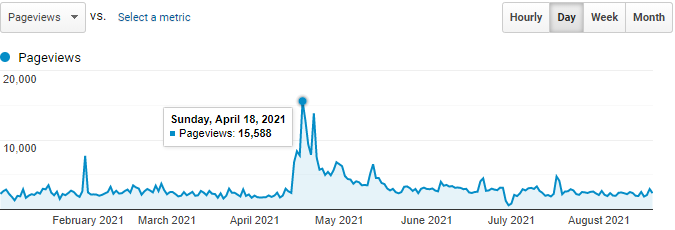
The second hit spike we'll look at took place earlier this year. Looking at the Audience -> Overview report for this year, we can see a more complex situation than with the first example, as this influx of traffic has multiple peaks and a long tail. The highest peak is April 18, 2021.
Step 1: Visit the Audience -> Overview report, and set the time period to encompass the hit spike.
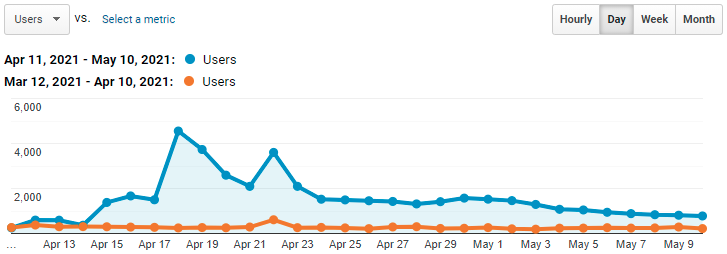
Most of this spike happens within a month, but the traffic volume remained elevated for months. This time we will set the date range to 30 days beginning April 11, 2021.

This gives the following view of the hit spike:
Step 2: Take a look at acquisition channels (from the Acquisition -> Overview report) to explore possible sources for this traffic.
With this date range, the Acquisition table on the Acquisition -> Overview report looks like this:
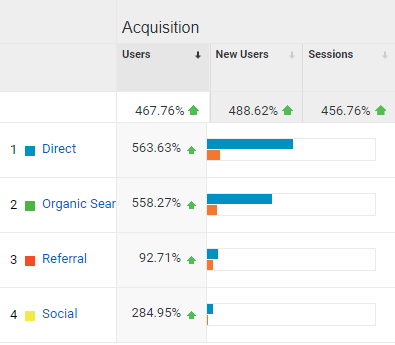
Here we can see relatively large percentage increases in direct, organic search and social sources, and a minor increase in referral traffic.
When we click on Organic Search and then select Primary Dimension: Source, we can see the following:
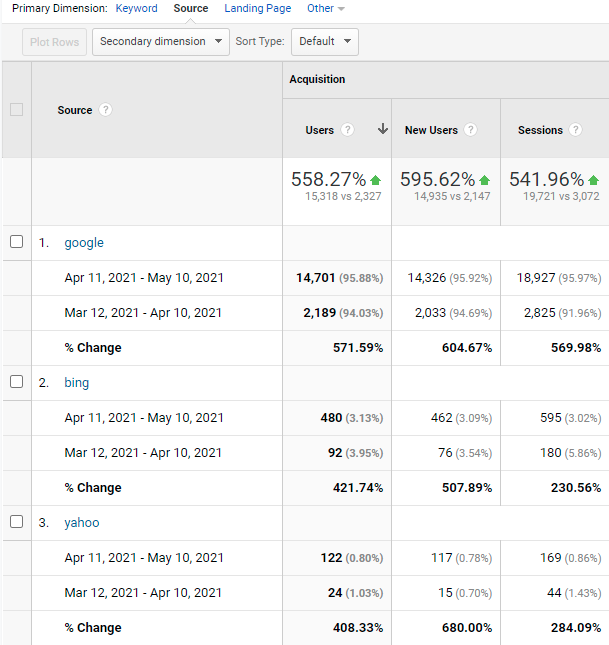
Traffic coming from multiple search engines has increased, but it is unclear why.
If we go back to the Acquisition -> Overview report and click on referral, we see the following:
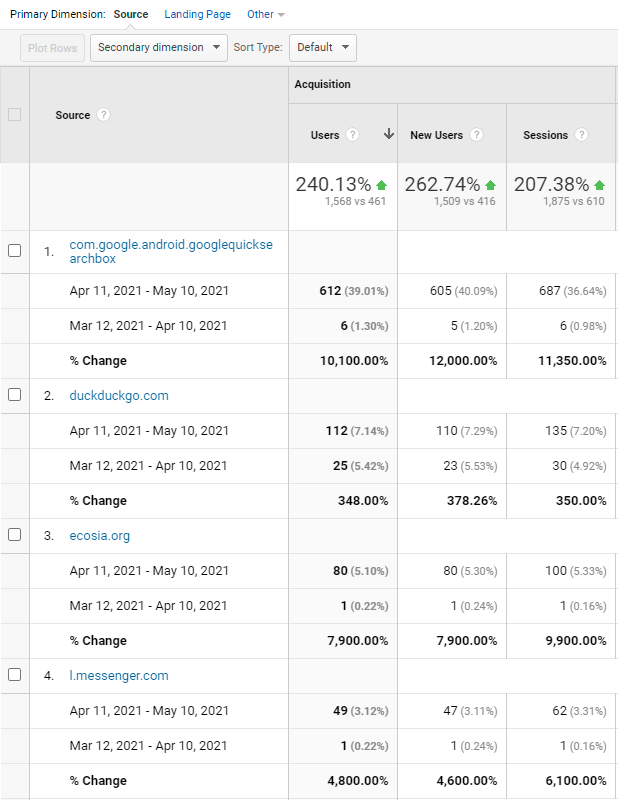
Referral is only a small amount of the total traffic of the hit spike, but aside from l.messenger.com, the major increases in traffic are actually from search engines. The first source, com.google.android.googlequicksearchbox, is actually part of one version of the Google Search app for Android, and duckduckgo.com and ecosia.org are also both search engines.
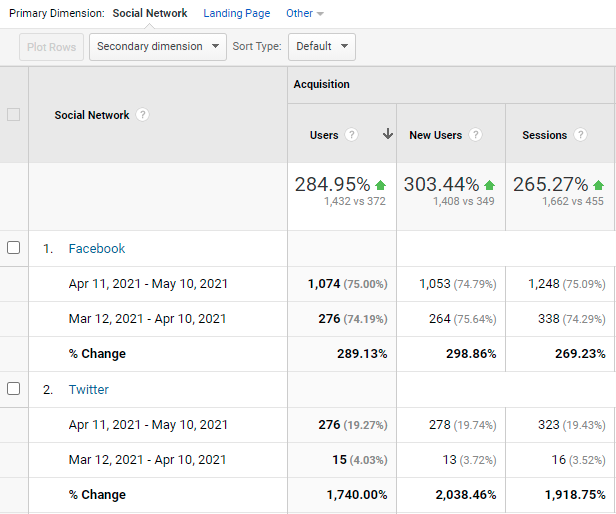
If we go back to the Acquisition -> Overview report and click on social, we can see major increases in traffic from Facebook and Twitter, but it is again unclear why.
Step 3: Explore the Audience -> Geo -> Location report to look for concentrations of traffic from particular geographical locations.
This is the map view on the location report:
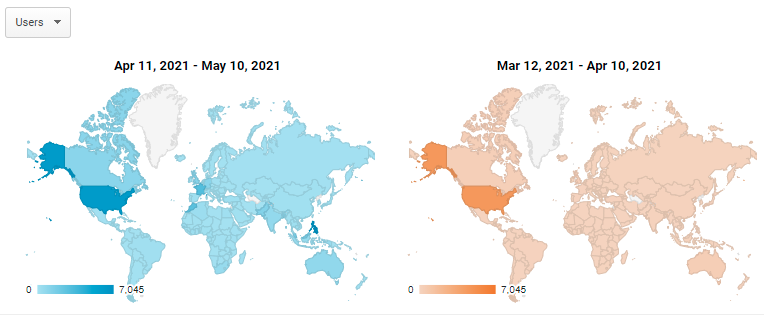
The table below this shows an interesting set of countries with large increases in hits:
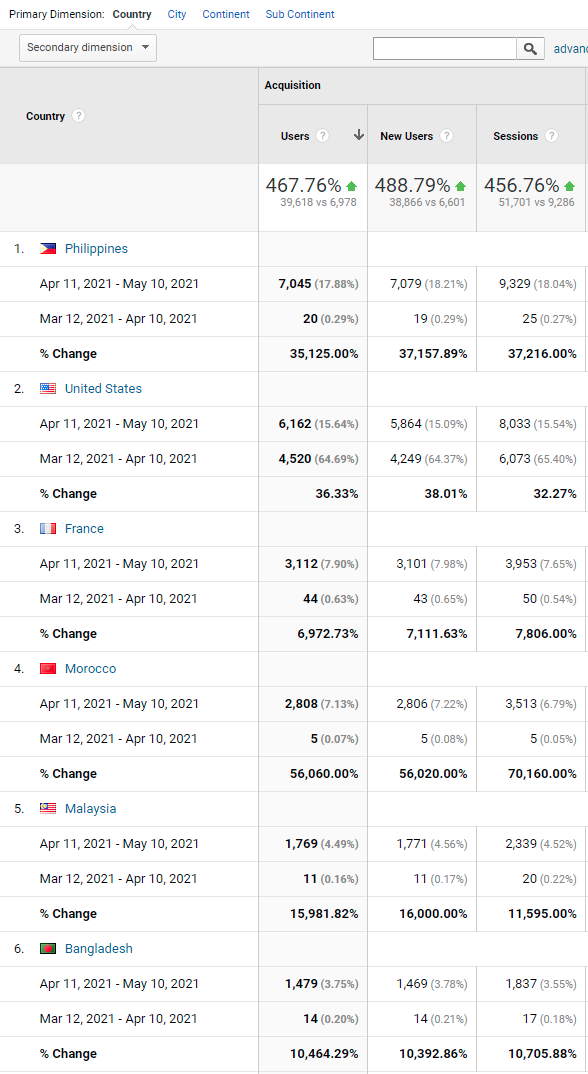
Looking deeper into the listing of countries reveals that in 197 out of 211 countries listed, hits increased by 100% or more, which is a very intriguing statistic. If we select Primary Dimension: City, that shows an interesting picture:
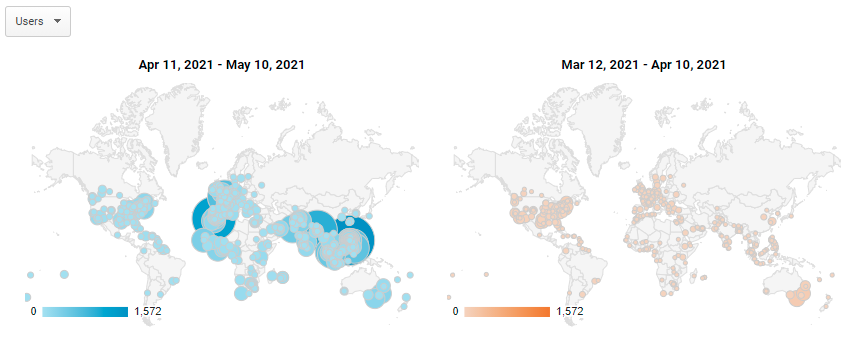
A larger view of the city view for April 11 - May 10 is below:
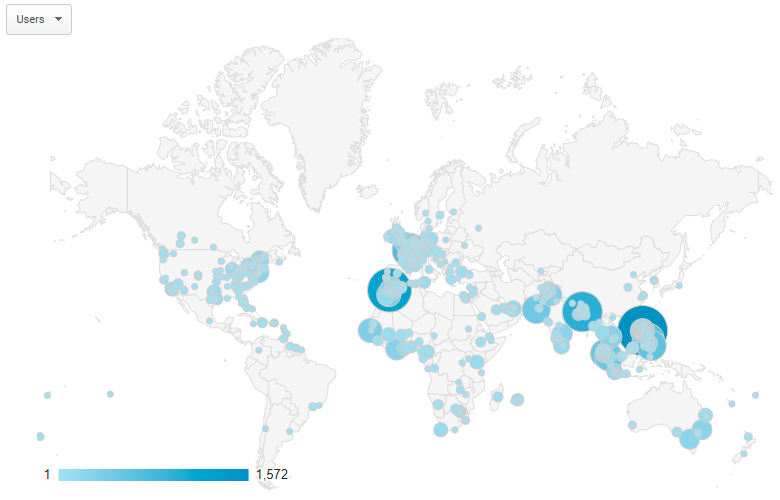
Particular hotspots are Quezon city in the Philippines, Dhaka in Bangladesh, Casablanca in Morocco, and Paris, France.
If on the Audience -> Geo -> Location report we remove the "Compare to" checkbox from the date range, and take a look at the top 20 countries hits are coming from, we can see the following:
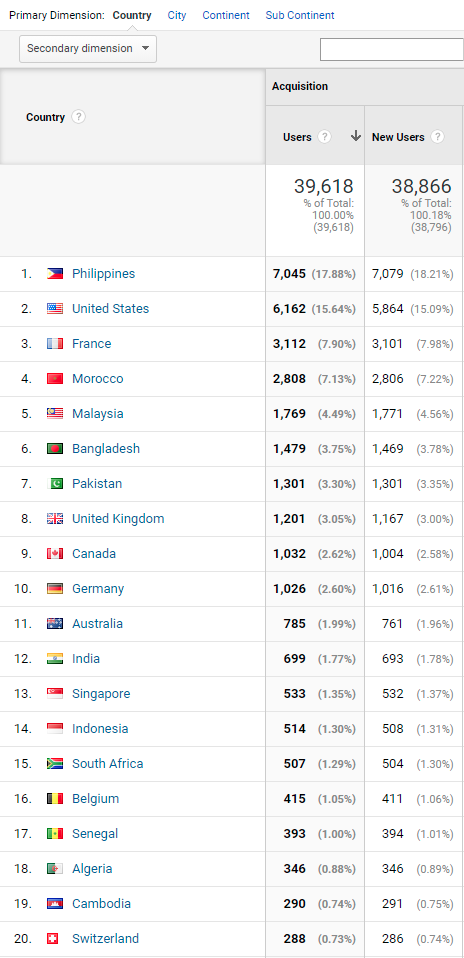
Although we can see a global increase in hits as well as particular hotspots around the world, we do not seem to have enough information to determine why this happened, in this case leading to many unanswered questions. Perhaps some popular news article, show, documentary, or site featured Elephind, leading to a lot more traffic? Why were there so many hits from the Philippines?
We did notice an article: makeuseof.com/tag/10-search-engines-explore-deep-invisible-web/ that since June 2017 has been causing intermittent small spikes of traffic to Elephind, but the latest spike occurred with only 89 users on 13 March 2021, which was a month before this large spike in traffic occurred.
We also noted that the link to Elephind from this site also includes the html attribute rel="noreferrer" which causes referral traffic to occur as direct traffic, so only some versions of this page actually show up as referral traffic. rel="noreferrer" is used in some specific cases as a privacy or security enhancement. These kinds of now common measures may have contributed to the outcome of this hit spike investigation, which is that we don't currently know what caused it. For now, that remains a mystery.
